3.1.3 Schematic Representation of an Economic System
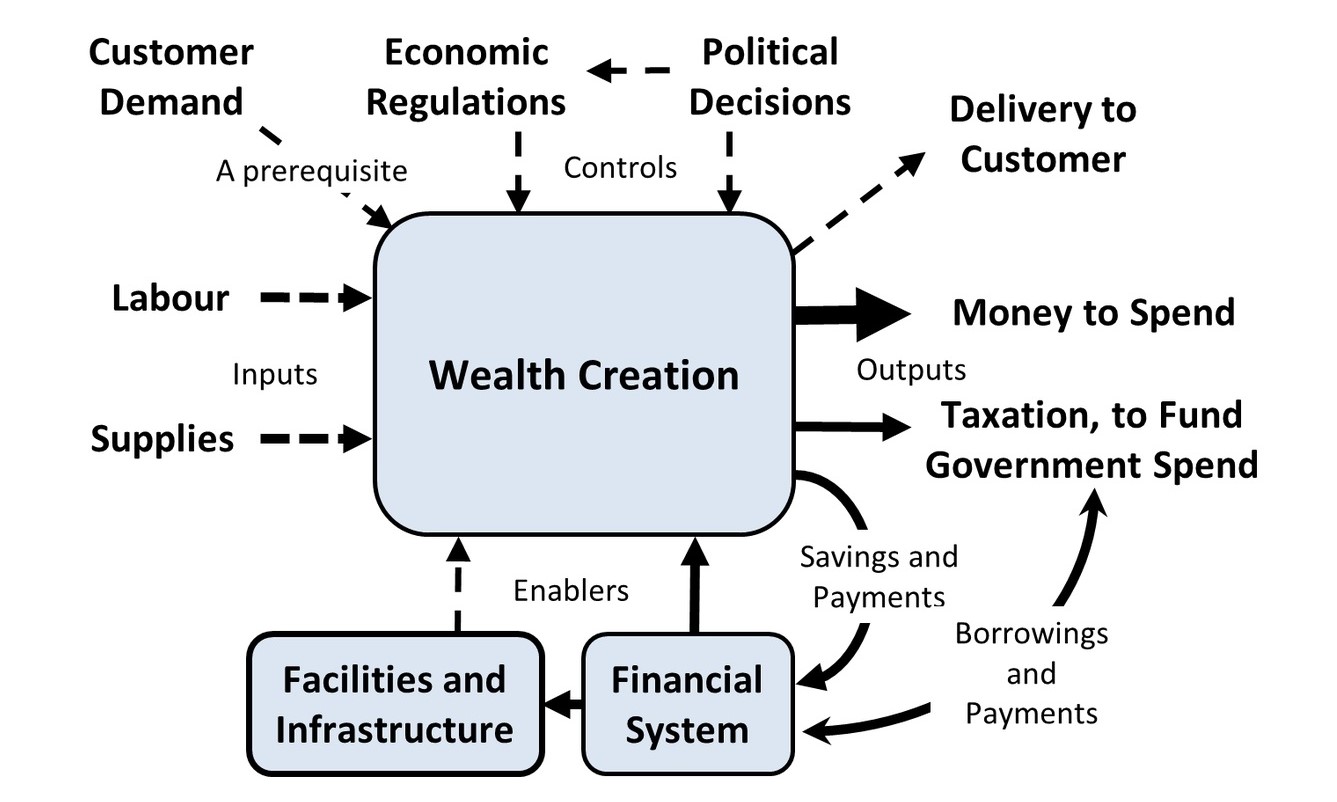
This schematic representation of an economic system shows how wealth is created and distributed
It is illustrated here as a network of power flows – with its inputs and outputs, and its controls and enablers:
The conventions adopted here need some explanation:
● The entire structure of relationships is subject to a hierarchy of regulations and political control.
● The solid arrows indicate flows of money. Dotted arrows denote the exercise of other types of power.
● Sales and purchases are not shown separately in this diagram as flows of money. Instead, the wealth created is shown: the amount by which the price paid by a customer exceeds the cost of supplies consumed.
● People create wealth by working, or by employing labour, to produce goods or services which are sold to customers: individuals, companies and governments.
● Customer demand is a pre-requisite for wealth creation. Wealth is created when goods or services are paid for.
● Wealth creators can then spend some of the proceeds. The larger arrow in the diagram emphasises its importance: the desire to spend is the principal incentive for creating wealth.
● Wealth creators might also pay some money into the financial system, as savings, loan repayments, or payments to investors. Individuals, businesses and governments all make use of the pool of available finance.
● Governments provide collective benefits and public services; they have several ways of deducting tax to pay for this.
● Facilities and infrastructure are needed to create and distribute wealth.
● People who work in the financial system, and those who build and maintain facilities and infrastructure, are also wealth creators.
● Intermediate transactions between businesses are all subsumed within the process of creation of wealth in this diagram; wealth creation is complete when the end-customer pays. With minor adjustments,[1] this model applies to any level of wealth creation: a person exchanging labour for payment, a business, a country or the global economy.
This schematic representation of an economic system illustrates its interconnectedness and its dependence on the availability of resources.
This page is part of Edition 4 of the Patterns of Power series of books. An archived copy of it is held at https://www.patternsofpower.org/edition04/313b.htm
[1] The labels on the model take on slightly different meanings at each level. The following list illustrates the meanings of the term ‘supplies’ at different levels of subsidiarity:
Employee: The cost of going to work
Company: Purchased goods and services
Country: Crops, extracted minerals and imports
World: Crops and extracted minerals
From the perspective of an individual employee, for example, who supplies his or her labour to an employer, the label ‘facilities and infrastructure’ might be interpreted as a car used to go to work; the ‘supplies’ might then be fuel; the wealth earned would be divided between the employee’s own consumer spending, taxes paid to the government and money paid into the financial system in the form of bank charges, savings or loan repayments.